The Use of Visuals as an Occupational Therapy Student
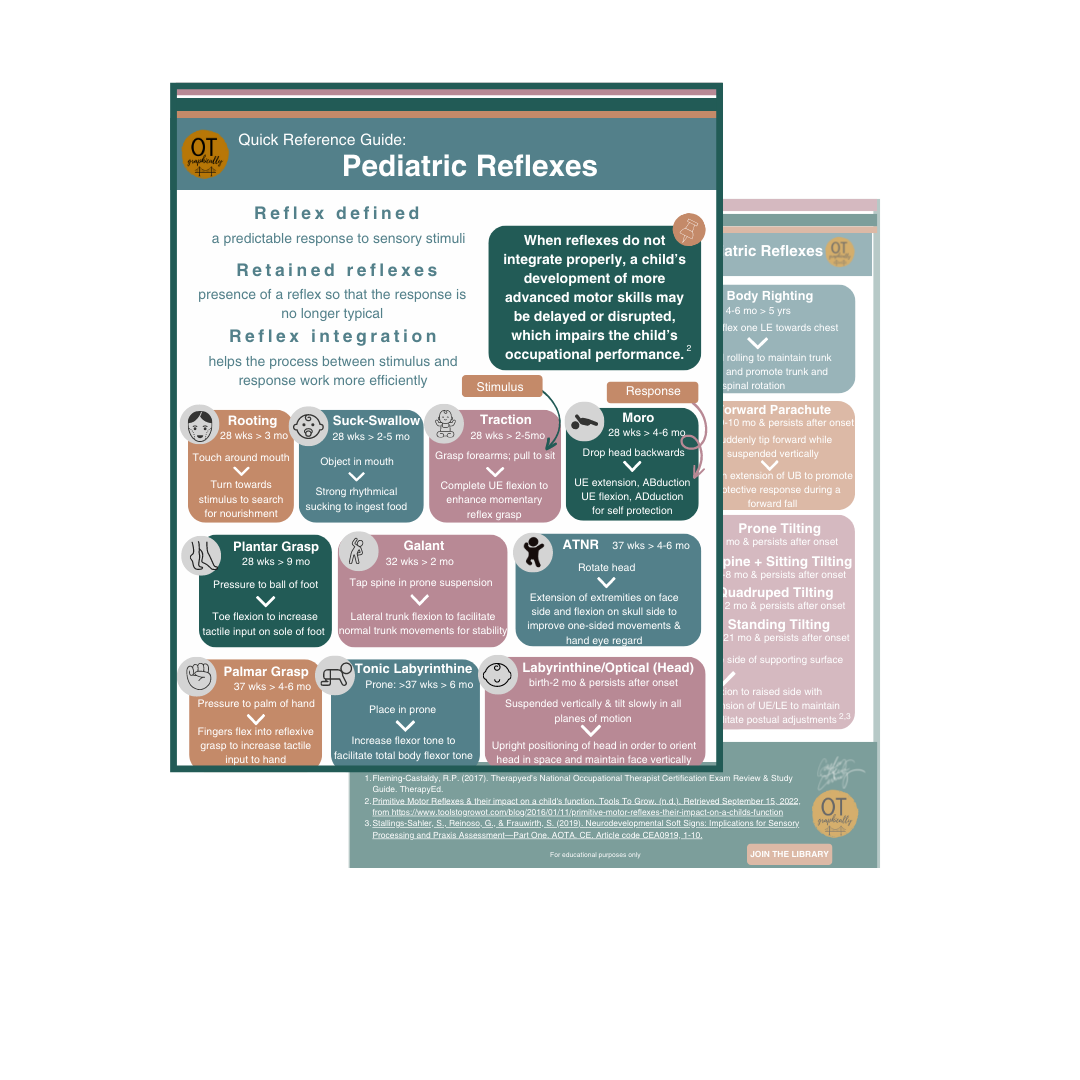
Quick Reference Guides on Pediatric Reflexes included in the OT Graphically Library
Someone recently asked me if I thought occupational therapy (OT) students would find it helpful to use infographics during their OT program.
Originally I was not sure that would be beneficial and had a hard time seeing it fit.
Then, I thought about my own personal experience with studying and I realized this is where I starting using visuals to help me understand complex information. As a visual learner, I had a really hard time just reading a chapter and retaining any information so I literally had to draw it out.
Here’s an example from my Biomechanics class notes about 13 years ago (yes I saved them, and yes I still draw a person like a gingerbread cookie).

Drawing out a complex process requires a really clear understanding of what is going on and allows you as a student to be able to play with the information in a way that makes sense to use and see where there might be some gaps in your knowledge.
A lot of times I would have to take my notes and later on transform them into these visuals in order to really solidify it in my brain.
When I started OT Graphically, I always thought infographics could be a get jumping off point for discussion of evidence-based practice in occupational therapy, however, I didn’t think of the additional benefit to students.
Here are some other ways that using visuals (like infographics) can help OT students
Presenting a project to the class or community
Sharing about your capstone project with administration, co-workers, and community members
Sharing a needs assessment
Sharing information on the importance of OT
Advocating for important topics on social media, through email, and beyond
Remembering complex topics while studying
I’m sure I’m not thinking of everything, but the benefits of using visuals to share as well as receive information are invaluable.
Imagine with me for a minute...
What if there was a way you could quickly find research about evidence-based interventions OTs are using in real-time and discuss it with current OT practitioners? What if you also had access to a library of infographics like this one

What if you could also find an article quickly for a project from a visually designed web like these:

For the month of September, anyone who signs up for a membership to the OT Graphically Library will also receive access to a Bonus Video showing some of the insides and behind-the-scenes tips for how we create infographics at OT Graphically.

You can learn how to create your own visuals and infographics using Canva while also accessing over 100 designs, 30 journal club replays, and growing and be a part of a larger OT community looking to stay up to date on evidence.